Happy Hour Promotion Metrics: What to Track and Why

Short answer
The best happy hour promotion metrics follow a simple path: impressions show reach; listing views and saves show consideration; directions, website clicks, and call taps show stronger intent; and validated redemptions show offer use. Track the full path and compare rates over equivalent time periods, rather than treating any single total as proof that a promotion worked.
Key takeaways
- Track metrics in stages: exposure, consideration, action intent, and redemption.
- Raw totals can mislead. Rates such as saves per listing view are more useful for comparing different promotions.
- Directions, call taps, and website clicks indicate intent, but they do not automatically prove an in-person visit or completed sale.
- A redemption is the closest listing-level measure of offer use, but it still needs sales and margin context to show profitability.
- Compare like with like: the same daypart, promotion length, audience, and offer type.
Table of contents
- Start with the customer action you want
- Track metrics as a funnel, not a scorecard
- Calculate rates that reveal listing quality
- Read common performance patterns
- Use a simple weekly measurement routine
- FAQ
A happy hour listing should do more than collect views. It should help the right nearby person understand the deal, decide the venue fits the moment, and take a next step. That is why the best measurement approach follows the customer journey instead of reporting a single headline number.
For Greenville venues, Happy Hour Flower is built around helping nearby deal-seekers discover current food and drink specials. Its venue offering describes analytics that show views, saves, and customer interest, alongside promotion and placement options. Happy Hour Flower's venue page supports this measurement approach by distinguishing basic and comprehensive analytics. (happyhourflower.com)
Start with the customer action you want
Before opening an analytics dashboard, decide what success should look like for this specific promotion. A 4–6 p.m. weekday cocktail special may be designed to fill an early slow period. A late-night food deal may be intended to increase repeat visits. A limited digital offer may be intended to generate trackable redemptions.
Use one primary goal and supporting metrics:
| Promotion goal | Most useful primary metric | Supporting metrics |
|---|---|---|
| More local awareness | Impressions | Listing views, save rate |
| More consideration | Listing views or saves | Impressions, detail-view rate |
| More immediate visit intent | Directions, website clicks, or call taps | Listing views, saves |
| More measurable offer use | Validated redemptions | Issued offers, action rate |
| More repeat interest | Saves over time | Repeat redemptions, follower actions where available |
This prevents a common mistake: celebrating high impressions when the actual goal was filling seats that afternoon. Visibility matters, but it is only the beginning of the path.
Track metrics as a funnel, not a scorecard
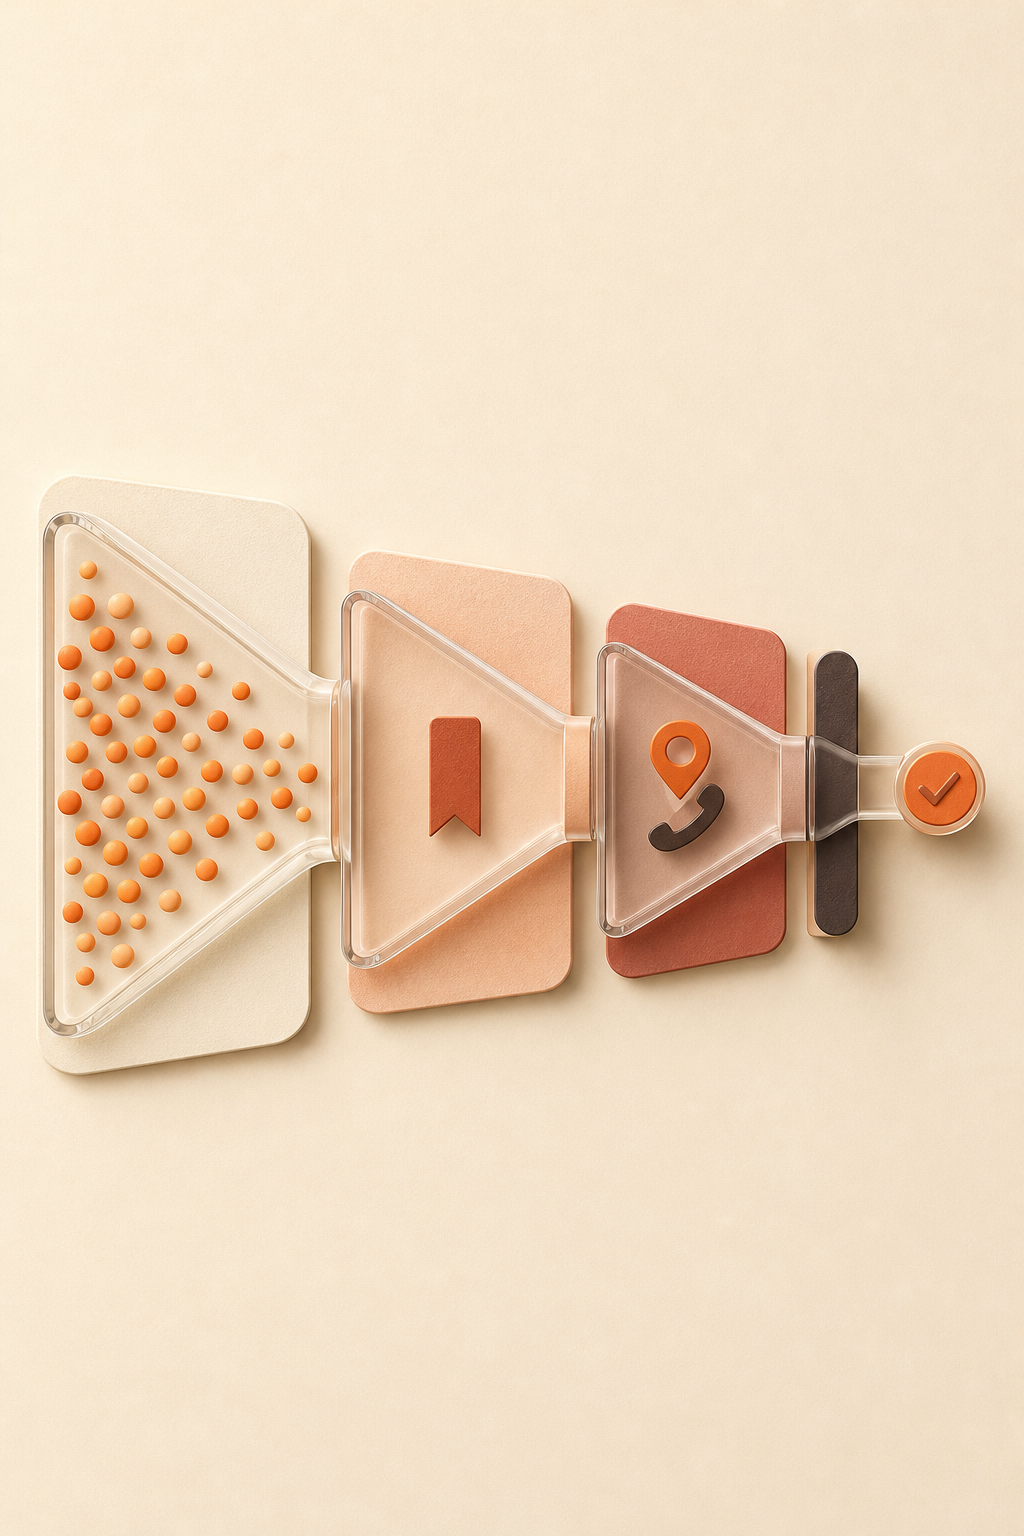
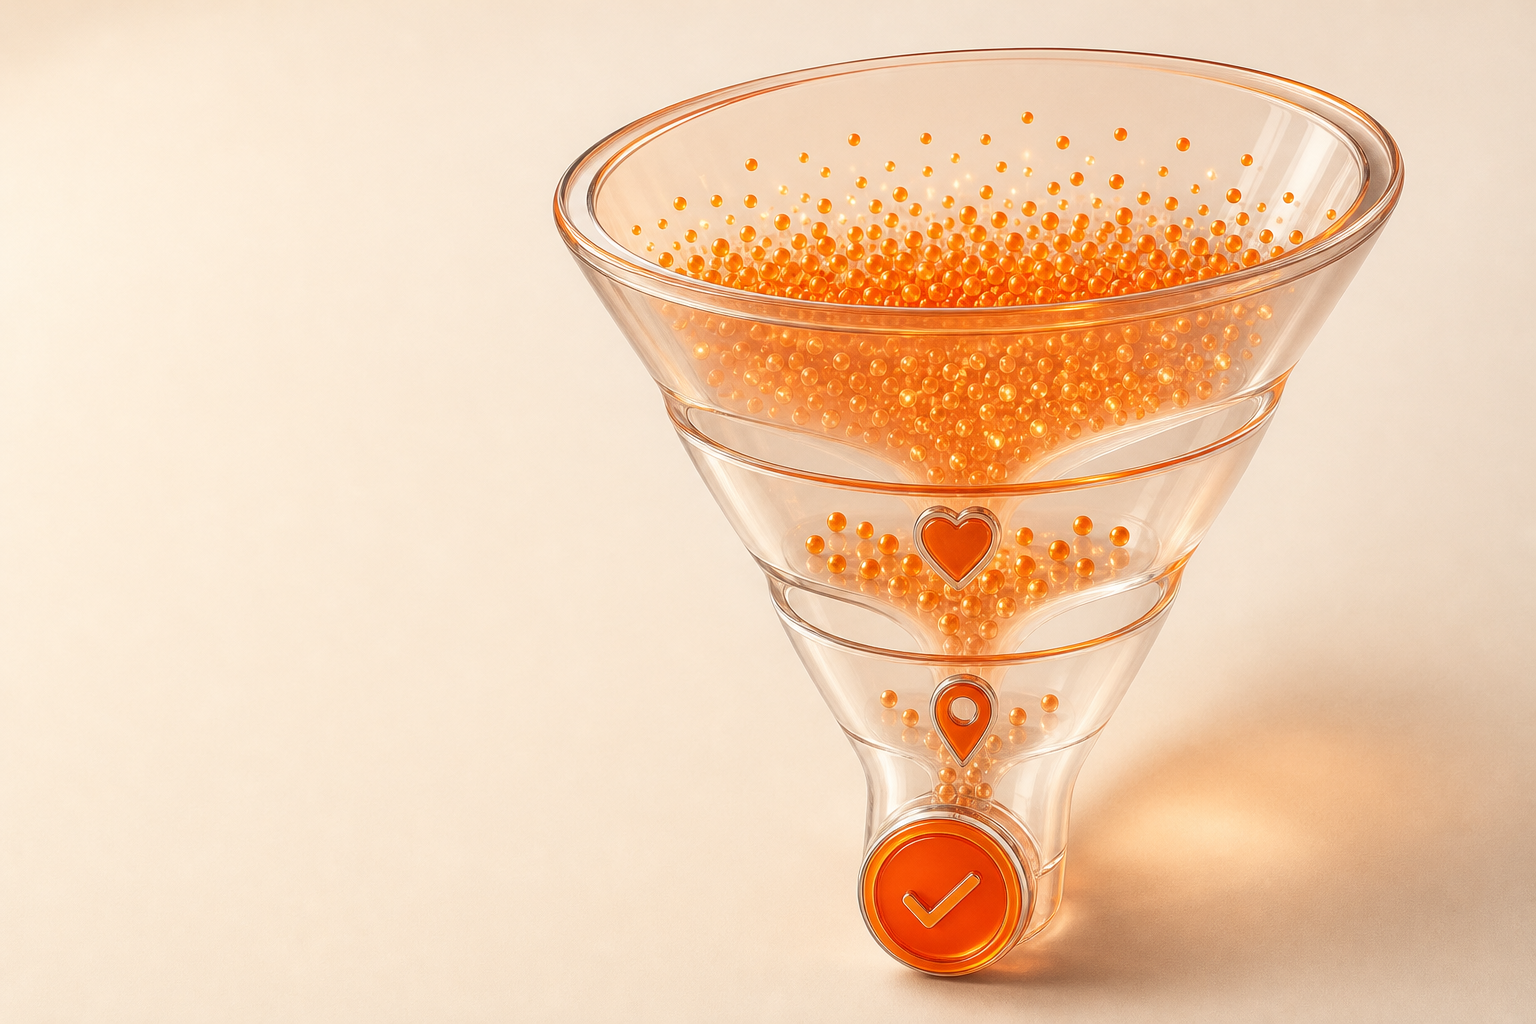
A useful happy hour dashboard has four layers. Keep the definitions used by your own platform nearby, since systems may count events differently.
1. Exposure: impressions
Impressions show how often the promotion or venue listing was surfaced. They answer: Did potential customers have a chance to see it?
Impressions are useful for identifying whether a promotion has reach, but they are not the same as clicks, calls, arrivals, or sales. For example, Google's business-performance documentation separately records Search and Maps impressions, direction requests, call clicks, and website clicks. It also notes that impressions can be counted once per user per day, depending on the metric. Google's Business Profile API documentation (developers.google.com)
2. Consideration: listing views and saves
Listing views show that a person moved beyond a surface-level appearance and opened more information, according to the platform's definition. They are a stronger signal than an impression because the listing had enough relevance to earn attention.
Saves usually signal future interest: the person may not be ready to go now, but wants an easy way to return to the venue or deal. Treat a save as a valuable consideration signal, not proof of a visit.
For a recurring happy hour, saves can be especially useful. A person may discover a Tuesday special on a Saturday, save it, and act later when the timing fits.
3. Intent: directions, website clicks, and call taps
These actions show a person taking a step toward a decision:
- Directions suggest that location and travel planning matter at that moment.
- Website or menu clicks suggest the person wants more detail before choosing.
- Call taps show an attempt to contact the venue directly.
These are high-value metrics, but label them accurately. A direction request is not a confirmed arrival, and a call tap is not a confirmed answered call or reservation. Google's metric definitions specifically describe direction requests and clicks on call and website buttons, rather than completed visits, conversations, or purchases. Google's Business Profile API documentation (developers.google.com)
4. Outcome: redemption-related actions
A validated redemption is usually the strongest listing-level outcome because it connects the promotion to an offer actually used. This could be a scanned wallet pass, a one-time code, or a staff-confirmed offer.
Still, a redemption is not automatically a profitable customer. To evaluate profitability, pair redemption data with information your point-of-sale process can provide, such as average check, contribution margin, and whether the guest purchased beyond the discounted item.
Calculate rates that reveal listing quality
Totals help with planning capacity, but rates make different promotions comparable. Calculate them over equivalent periods—for example, each Tuesday happy hour over four comparable weeks.
| Rate | Formula | What it helps diagnose |
|---|---|---|
| Detail-view rate | Listing views ÷ impressions | Whether the listing earns attention after appearing |
| Save rate | Saves ÷ listing views | Whether people see enough future value to return later |
| High-intent action rate | (Directions + website clicks + call taps) ÷ listing views | Whether interested viewers move toward a visit or contact |
| Redemption rate | Validated redemptions ÷ issued or claimed offers | Whether a distributed offer is actually used |
For example, imagine two promotions each receive 1,000 impressions. Promotion A receives 100 listing views and 20 saves. Promotion B receives 200 listing views and 10 saves. Promotion B is better at earning detail views, while Promotion A creates more saves per view. The next decision is different for each: improve A's visibility or appeal, and improve B's offer clarity, urgency, or fit.
Avoid combining every action into one vague conversion total. A save, a direction request, and a validated redemption represent different levels of commitment. Combining them can hide the exact part of the customer journey that needs work.
Read common performance patterns

Use combinations of metrics to identify the likely problem before changing the offer.
| What you see | Likely interpretation | Practical next move |
|---|---|---|
| High impressions, low listing views | The promotion appears but does not earn attention | Clarify the deal, timing, eligibility, and hero photo; check whether the title states the actual value |
| Strong views, few saves | People are curious but do not see a reason to return | Make recurring days, time windows, and standout items easy to understand |
| Strong saves, weak directions or clicks | The listing may be building future consideration rather than immediate demand | Keep the listing current and use a timely reminder shortly before the offer starts |
| Strong directions or call taps, weak redemption | Intent is present, but the offer may be difficult to find, understand, or validate in person | Check staff awareness, redemption instructions, exclusions, and time limits |
| Redemptions rise but profitability is unclear | The offer is being used, but the business result is unknown | Review basket size, add-on sales, labor pressure, and margin with POS data |
Do not react to one unusually busy or slow shift. Weather, local events, seasonality, school schedules, and competing promotions can affect hospitality demand. Look for a repeated pattern before making a major change.
Use a simple weekly measurement routine
A consistent routine is more valuable than a complicated dashboard that no one revisits.
- Choose one reporting window. Review the previous seven days, then compare it with the prior equivalent seven-day period.
- Separate promotions. Track a recurring happy hour, a one-night flash deal, and a premium offer separately. Their audiences and expected behaviors differ.
- Record the context. Note the offer, day, start and end time, notification or featured-placement activity, and any local factor that could affect demand.
- Review the funnel. Start with impressions, then listing views, saves, high-intent actions, and redemptions where available.
- Change one meaningful variable. For example, improve the deal title, change the photo, simplify exclusions, or adjust the time window. Avoid changing everything at once.
- Keep a baseline. Compare each promotion with its own prior performance, not with a generic industry average.
Happy Hour Flower's venue plans describe analytics dashboards, weekly reports, featured placement, notifications, and location-based promotional options. If you need a venue listing and promotion setup that matches your measurement goals, review the available venue plan options. (happyhourflower.com)
FAQ
What is the most important happy hour promotion metric?
The most important metric depends on the goal. For awareness, start with impressions. For a promotion intended to prompt a near-term visit, directions, website clicks, and call taps are more useful. For a controlled digital offer, validated redemptions are the closest measure of offer use.
What is a good save rate or action rate for a happy hour listing?
There is no universal good rate. Compare the same venue's promotions across similar dayparts, offer types, locations, and durations. A weekday drink special and a limited Saturday dinner offer should not be judged against the same baseline.
Do directions and call taps prove someone visited the venue?
No. They show a meaningful action, but not a confirmed arrival, completed phone conversation, or purchase. Treat them as intent signals and pair them with redemption or sales data when you need a clearer business-outcome picture.
Should a venue track redemptions even when a promotion is free to publish?
Yes, when the promotion uses a controlled code, pass, or staff-confirmed offer. Redemption data helps distinguish general interest from actual offer use. It should be reviewed alongside sales and margin information before deciding whether to repeat or expand the deal.
The practical goal is not to chase the largest number on the dashboard. It is to understand where people stop in the journey from discovery to redemption, then improve that one step. A clear offer, accurate hours, current details, and consistent measurement give a happy hour listing its best chance to turn local discovery into useful demand.
Related articles

Where to Find Lunch Specials in Greenville, SC
Find Greenville lunch specials worth checking today, compare deal types, and use a quick method to confirm prices, hours, and availability before lunch.

Google Maps vs. Yelp for Finding Happy Hour Deals
Compare Google Maps and Yelp for happy hour: what each can tell you, what they cannot, and how to verify today’s deal before you go.

How to Advertise Happy Hour and Fill Slow Hours
Learn how to advertise happy hour with clear offers, local discovery, compliant messaging, and simple tracking for slower shifts.